Monthly Rubber Statistics Malaysia, December 2022 |
Natural Rubber (NR) production increased by 8.9 per cent in December 2022 (30,556 tonnes) as compared to November 2022 (28,048 tonnes). Year-on-year comparison showed that the production of NR decreased by 26.7 per cent (December 2021: 41,690 tonnes). Release Date : Tuesday 07, February 2023 1200 |
Selected Agricultural Indicators, Malaysia, 2022
|
The production of four major commodity crops, namely fresh fruit bunches (oil palm), natural rubber, kenaf (dried stem) and cocoa beans, in 2021 showed a decreasing trend as compared to 2020. Though the production of fresh fruit bunches (oil palm) was the highest among the agricultural commodities, its production decreased by 5,575.6 thousand tonnes with 5.7 per cent as compared to previous year. Release Date : Tuesday 25, October 2022 1200 |
Supply and Utilization Accounts Selected Agricultural Commodities, Malaysia 2017-2021
|
26 selected agricultural items recorded Self-Sufficiency Ratio (SSR) 100 per cent and more Release Date : Monday 12, September 2022 1200 |
Value of gross output of agriculture sector registered an annual growth rate of 11.1 per cent to RM91.2 billion
|
Gross output of agriculture sector in 2017 was RM91.2 billion, an increase of 11.1 per cent per year compared to RM73.9 billion in 2015. Value added for this sector also increased to RM54.9 billion and value of intermediate input also increased by 6.0 per cent per year from RM32.4 billion to RM36.3 billion within the same period. Release Date : Wednesday 03, April 2019 1200 |
Annual Rubber Statistics 2016 |
In 2015, the production of natural rubber was 722,122 tonnes as compared to 939,241 tonnes in 2010 with an annual growth rate of -5.1 per cent. Smallholding sector was the main contributor to the production of natural rubber at 665,301 tonnes or 92.1 per cent of the total production while 7.9 per cent was from estate sector. Release Date : Thursday 30, November 2017 1200 |
Value added of fisheries sub-sector recorded an annual growth rate of 10.2 per cent in five years period |
In 2015, number of establishments involved in the fisheries sub-sector was 1,229 establishments. Gross output value was RM2,226.0 million or 3.0 per cent from total gross output of the agriculture sector with value added of RM747.6 million. This sub-sector also provides job opportunities to 15,690 people with salaries & wages paid amounting RM315.0 million. Release Date : Monday 07, August 2017 1200 |
Value added of forestry and logging sub-sector recorded an annual growth rate of 2.2 per cent in 5 years period |
In 2015, number of establishments involved in the forestry and logging sub-sector was 766 establishments. Gross output value was RM7,552.2 million or 10.2 per cent from total gross output of the agriculture sector with value added of RM3,006.0 million. This sub-sector also provides job opportunities to 26,034 people with salaries & wages paid amounting RM737.3 million. Release Date : Monday 07, August 2017 1200 |
Economic Census 2016 - Crops |
In 2015, number of establishments involved in the crops sub-sector was 8,029 establishments. Gross output value was RM50,763.3 million or 68.7 per cent from total gross output of the agriculture sector with value added of RM34,309.5 million. This sub-sector also provides job opportunities to 368,002 people with salaries & wages paid amounting RM6,125.8 million. Release Date : Monday 10, July 2017 1200 |
Economic Census 2016 - Livestock |
In 2015, number of establishments involved in the livestock sub-sector was 1,604 establishments. Gross output value was RM13,312.1 million or 18.0 per cent from total gross output of the agriculture sector with value added of RM3,410.3 million. This sub-sector also provides job opportunities to 34,805 people with salaries & wages paid amounting RM726.2 million. Release Date : Monday 10, July 2017 1200 |
|
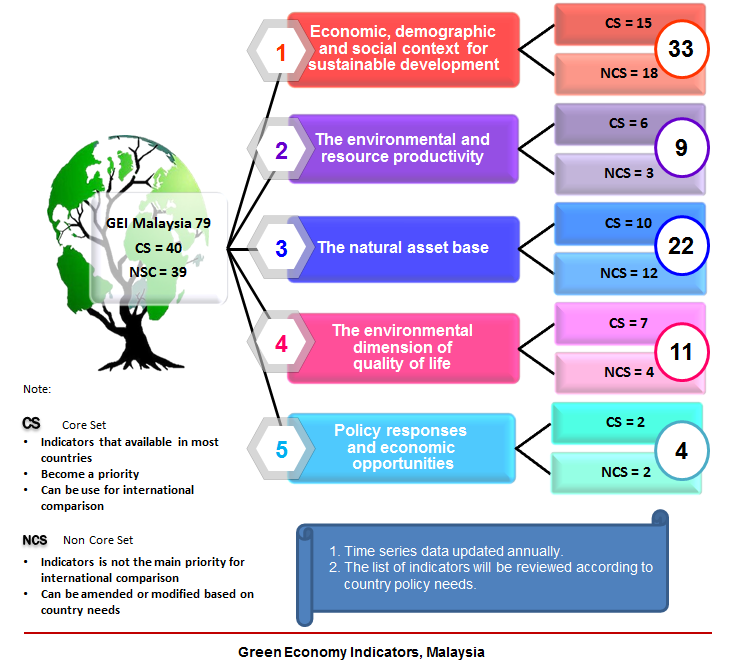
GREEN ECONOMY INDICATORS |
|
|
|
LIST OF GREEN ECONOMY INDICATORS IN MALAYSIA |
|
|


SUSTAINABLE DEVELOPMENT GOAL
Goal 1: End poverty in all its forms everywhere
14 INDICATORS
|
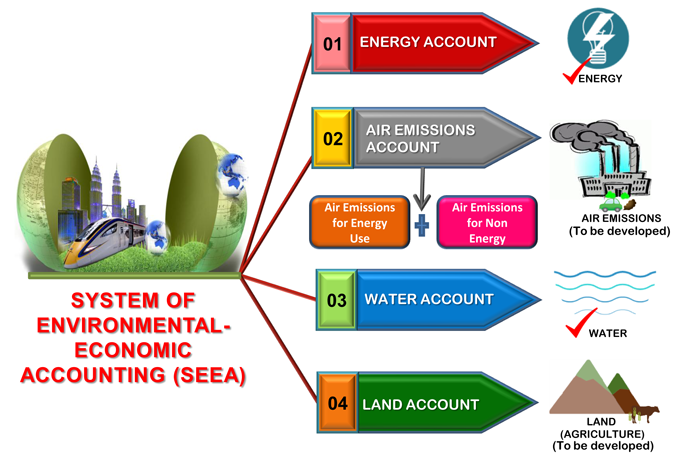
SYSTEM OF ENVIRONMENTAL-ECONOMIC ACCOUNTING (SEEA)
|
|
Malaysia has been selected by United Nations Statistics Division (UNSD) to conduct a development account project “Supporting Member States in Developing and Strengthening Environment Statistics and Integrated Environmental-Economic Accounting for Improved Monitoring of Sustainable Development” for the period of 2016 - 2017. Two outputs from this project are Roadmap SEEA Malaysia and SEEA Water Account. |
|
SUGGESTED SEEA ACCOUNT
|
|
|

Federal Territory of Kuala Lumpur

Federal Territory of Putrajaya

Federal Territory of Labuan

Perlis

Kedah

Pulau Pinang

Perak

Kelantan

Terengganu

Johor

Sarawak

Sabah

Selangor

Negeri Sembilan

Melaka
Federal Territory of Kuala Lumpur
Federal Territory of Putrajaya
Federal Territory of Labuan
Perlis
Kedah
Pulau Pinang
Perak
Kelantan
Terengganu
Johor
Sarawak
Sabah
Selangor
Negeri Sembilan
Melaka
Federal Territory of Kuala Lumpur
Federal Territory of Putrajaya
Federal Territory of Labuan
Perlis
Kedah
Pulau Pinang
Perak
Kelantan
Terengganu
Johor
Sarawak
Sabah
Selangor
Negeri Sembilan
Melaka
Federal Territory of Kuala Lumpur
Federal Territory of Putrajaya
Federal Territory of Labuan
Perlis
Kedah
Pulau Pinang
Perak
Kelantan
Terengganu
Johor
Sarawak
Sabah
Selangor
Negeri Sembilan
Melaka
Federal Territory of Kuala Lumpur
Federal Territory of Putrajaya
Federal Territory of Labuan
Perlis
Kedah
Pulau Pinang
Perak
Kelantan
Terengganu
Johor
Sarawak
Sabah
Selangor
Negeri Sembilan
Melaka
Federal Territory of Kuala Lumpur
Federal Territory of Putrajaya
Federal Territory of Labuan
Perlis
Kedah
Pulau Pinang
Perak
Kelantan
Terengganu
Johor
Sarawak
Sabah
Selangor
Negeri Sembilan
Melaka
Federal Territory of Kuala Lumpur
Federal Territory of Putrajaya
Federal Territory of Labuan
Perlis
Kedah
Pulau Pinang
Perak
Kelantan
Terengganu
Johor
Sarawak
Sabah
Selangor
Negeri Sembilan
Melaka
Federal Territory of Kuala Lumpur
Federal Territory of Putrajaya
Federal Territory of Labuan
Perlis
Kedah
Pulau Pinang
Perak
Kelantan
Terengganu
Johor
Sarawak
Sabah
Selangor
Negeri Sembilan
Melaka
Federal Territory of Kuala Lumpur
Federal Territory of Putrajaya
Federal Territory of Labuan
Perlis
Kedah
Pulau Pinang
Perak
Kelantan
Terengganu
Johor
Sarawak
Sabah
Selangor
Negeri Sembilan
Melaka
Federal Territory of Kuala Lumpur
Federal Territory of Putrajaya
Federal Territory of Labuan
Perlis
Kedah
Pulau Pinang
Perak
Kelantan
Terengganu
Johor
Sarawak
Sabah
Selangor
Negeri Sembilan