Monthly Rubber Statistics Malaysia, December 2022 |
Natural Rubber (NR) production increased by 8.9 per cent in December 2022 (30,556 tonnes) as compared to November 2022 (28,048 tonnes). Year-on-year comparison showed that the production of NR decreased by 26.7 per cent (December 2021: 41,690 tonnes). Release Date : Tuesday 07, February 2023 1200 |
Selected Agricultural Indicators, Malaysia, 2022
|
The production of four major commodity crops, namely fresh fruit bunches (oil palm), natural rubber, kenaf (dried stem) and cocoa beans, in 2021 showed a decreasing trend as compared to 2020. Though the production of fresh fruit bunches (oil palm) was the highest among the agricultural commodities, its production decreased by 5,575.6 thousand tonnes with 5.7 per cent as compared to previous year. Release Date : Tuesday 25, October 2022 1200 |
Supply and Utilization Accounts Selected Agricultural Commodities, Malaysia 2017-2021
|
26 selected agricultural items recorded Self-Sufficiency Ratio (SSR) 100 per cent and more Release Date : Monday 12, September 2022 1200 |
Value of gross output of agriculture sector registered an annual growth rate of 11.1 per cent to RM91.2 billion
|
Gross output of agriculture sector in 2017 was RM91.2 billion, an increase of 11.1 per cent per year compared to RM73.9 billion in 2015. Value added for this sector also increased to RM54.9 billion and value of intermediate input also increased by 6.0 per cent per year from RM32.4 billion to RM36.3 billion within the same period. Release Date : Wednesday 03, April 2019 1200 |
Annual Rubber Statistics 2016 |
In 2015, the production of natural rubber was 722,122 tonnes as compared to 939,241 tonnes in 2010 with an annual growth rate of -5.1 per cent. Smallholding sector was the main contributor to the production of natural rubber at 665,301 tonnes or 92.1 per cent of the total production while 7.9 per cent was from estate sector. Release Date : Thursday 30, November 2017 1200 |
Value added of fisheries sub-sector recorded an annual growth rate of 10.2 per cent in five years period |
In 2015, number of establishments involved in the fisheries sub-sector was 1,229 establishments. Gross output value was RM2,226.0 million or 3.0 per cent from total gross output of the agriculture sector with value added of RM747.6 million. This sub-sector also provides job opportunities to 15,690 people with salaries & wages paid amounting RM315.0 million. Release Date : Monday 07, August 2017 1200 |
Value added of forestry and logging sub-sector recorded an annual growth rate of 2.2 per cent in 5 years period |
In 2015, number of establishments involved in the forestry and logging sub-sector was 766 establishments. Gross output value was RM7,552.2 million or 10.2 per cent from total gross output of the agriculture sector with value added of RM3,006.0 million. This sub-sector also provides job opportunities to 26,034 people with salaries & wages paid amounting RM737.3 million. Release Date : Monday 07, August 2017 1200 |
Economic Census 2016 - Crops |
In 2015, number of establishments involved in the crops sub-sector was 8,029 establishments. Gross output value was RM50,763.3 million or 68.7 per cent from total gross output of the agriculture sector with value added of RM34,309.5 million. This sub-sector also provides job opportunities to 368,002 people with salaries & wages paid amounting RM6,125.8 million. Release Date : Monday 10, July 2017 1200 |
Economic Census 2016 - Livestock |
In 2015, number of establishments involved in the livestock sub-sector was 1,604 establishments. Gross output value was RM13,312.1 million or 18.0 per cent from total gross output of the agriculture sector with value added of RM3,410.3 million. This sub-sector also provides job opportunities to 34,805 people with salaries & wages paid amounting RM726.2 million. Release Date : Monday 10, July 2017 1200 |
Quarterly Construction Statistics, Fourth Quarter 2022
|
The Construction sector continued to perform favourably in the fourth quarter 2022 with growth of 15.7 per cent, while overall 2022 posted a rebound of |
Annual Economic Statistics 2018: Construction
|
Value of gross output Construction in 2017 registered an annual growth rate of 7.2 per cent to RM204.4 billion as compared to 2015, RM177.9 billion. |
Economic Census 2016 - Construction
|
The overall performance of the construction sector in 2015 recorded a positive growth in all key indicators. The gross output in 2015 was RM177.9 billion, an increase of RM86.6 billion as compared to 2010 with compound annual growth rate of 14.3 per cent. |
Malaysian Economic Indicators: Leading, Coincident & Lagging Indexes November 2022
|
Malaysia’s Leading Index remains moderate by recording 110.5 points in November 2022 |
Business Tendency Statistics Fourth Quarter 2022
|
Businesses remain upbeat on business situation in the fourth quarter of 2022 with confidence indicator of +3.2 per cent |
Malaysia Input-Output Tables, 2019 & 2020
|
Total Supply and Use recorded at RM4.1 trillion in 2020 |
Distribution & Use of Income Accounts And Capital Account (DUIACA), 2015 |
Malaysia’s Economy Driven by Non-Financial Sector Release Date : Tuesday 31, July 2018 1200 |
Environment Statistics 2022
|
Environment Statistics 2022 which published by the Department of Statistics Malaysia is a new publication that presents environmental statistics for 14 states encompassing six (6) components namely Environmental Conditions & Quality; Environmental Resources & Their Use; Residuals; Extreme Events & Disasters; Human Settlements & Environmental Health; and Environmental Protection, Management & Engagement. |
Compendium of Environment Statistics, Malaysia, 2022
|
The Compendium of Environment Statistics, Malaysia, 2022 presents statistics on six environment components namely Environmental Conditions and Quality; Environmental Resources and Their Use; Residuals; Extreme Events and Disasters; Human Settlements and Environmental Health; and Environmental Protection, Management and Engagement. The compilation of these statistics includes environment information and conditions, impacts of human activities on environment and actions taken to minimise the impact. Appendices and glossary covered in the fourth and fifth parts are to facilitate users in understanding the statistics and environment terms used. |
Report On The Survey Of Environmental Protection Expenditure 2021
|
Industry players in Malaysia spent RM2.97 billion on environmental protection in 2020, 3.0 per cent higher than the value expended in 2019. |
MySEEA PSUT WATER ACCOUNT, 2015
|
Malaysia registered total water abstraction of 14,791 millions of cubic metres |
MySEEA PSUT Energy, 2015
|
The publication of System of Environmental - Economic Accounting Physical Supply & Use Table: Energy Account (MySEEA PSUT Energy), 2015 is an inaugural report that presents information on energy supply and use in Malaysia for the year 2015 in physical unit. |
Annual Economic Statistics 2018 Water Supply; Sewerage, Waste Management & Remediation Activities |
Performance of Water supply; sewerage, waste management and remediation activities for 2017 registered a 8.1 per cent growth in value of gross output to RM14.4 billion as compared to 2015. Release Date : Thursday 28, February 2019 1200 |
Economic Census 2016 - Environmental Compliance |
Environmental Protection Expenditure increased to RM2.55 billion in 2015 with annual growth rate of 3.9%. Release Date : Monday 06, November 2017 1200 |
Economic Census 2016 - Water Supply; Sewerage, Waste Management and Remediation Activities |
In 2015, 784 establishments were operating in Water supply; sewerage, waste management and remediation activities sector compared to 601 establishments in 2010 with a compounded annual growth rate (CAGR) of 5.5 per cent. Value of gross output grew by 8.0 per cent per year to RM11.6 billion compared to RM7.8 billion in 2010. The growth was further strengthened by an increase of value added at 9.3 per cent per year to RM5.5 billion compared to RM3.5 billion in 2010. Release Date : Monday 10, July 2017 1200 |
Quarterly Balance of Payments, Fourth Quarter 2022
|
Malaysia’s Current Account Balance logged RM47.2 billion in 2022, Services improving as Travel receipts reaching 34 per cent of pre-pandemic levels |
International Investment Position, Fourth Quarter 2022
|
Malaysia's international investment position as at the end of Q4 2022 recorded a lower net assets of RM63.0 billion |
Malaysian Economic Statistics Review (MESR), Volume 1/2023
|
MESR Volume 1/2023 presents the latest economic scenario based on the official macroeconomic statistics released by DOSM for November and some forthcoming statistics for December 2022. |
Malaysia External Trade Indices, December 2022
|
Both the Export & Import Unit Value Indices decreased by 2.8 per cent |
Malaysia External Trade Statistics Bulletin, December 2022
|
KEY FACTS |
Malaysia Trade Statistics Review
|
OVERVIEW |
Statistics of Foreign Direct Investment in Malaysia, 2021 |
Malaysia’s FDI recorded RM48.1 billion in 2021, signalling the robust recovery ahead Release Date : Friday 17, June 2022 1200 |
Statistics on Malaysia's Direct Investment Abroad, 2021 |
Malaysia’s DIA posted RM19.7 billion in 2021, signalling the robust recovery ahead Release Date : Friday 17, June 2022 1200 |
Malaysia External Trade Statistics By State 2022 |
Malaysia’s total trade in 2021 recorded a new milestone, surpassing RM2 trillion for the first time in history, with a double-digit expansion of 24.8 per cent after recording two consecutive years of negative growth. Release Date : Wednesday 08, June 2022 1200 |
Statistics of International Trade In Services 2021 |
Malaysia’s services trade recorded a deficit of RM60.7 billion owing to lower inbound Travel in 2021 Release Date : Wednesday 08, June 2022 1200 |
Statistics on Foreign Affiliates in Malaysia, 2020 |
Despite uncertain economic situation in 2020, foreign affiliates in Malaysia continued to show good performance by contributing 17.0 per cent to the Malaysia's economy Release Date : Tuesday 14, September 2021 1200 |
Statistics on Malaysian Affiliates Abroad 2019 |
Malaysian affiliates abroad registered higher turnover of RM335.2 billion in 2019. Release Date : Tuesday 14, September 2021 1200 |
ICT Use and Access by Individuals and Households Survey Report, Malaysia, 2021
|
The percentage of individuals in Malaysia aged 15 years and above using computers from 80.0 per cent in 2020 to 83.5 per cent in 2021. Internet usage by individuals in Malaysia increased to 96.8 per cent from 89.6 per cent in 2020. Meanwhile, the percentage of individuals using mobile phone increased to 98.7 per cent in 2021 as compared to 98.2 per cent in 2020. |
Household Income Estimates and Incidence of Poverty Report, Malaysia, 2020
|
Mean household income declined 10.3 per cent as a result of the Covid-19 pandemic in 2020 |
Household Expenditure Survey Report 2019
|
The mean monthly household consumption expenditure for Malaysia increased from RM4,033 in 2016 to RM4,534 in 2019 which grew at 3.9 per cent per annum. |
Household Income & Basic Amenities Survey Report 2019
|
In 2019, mean income in Malaysia was RM7,901 while Malaysia’s median income recorded at RM5,873. In terms of growth, median income in Malaysia grew by 3.9 per cent per year in 2019 as compared to 6.6 per cent in 2016. Moreover, mean income rose at 4.2 per cent in 2019. |
|
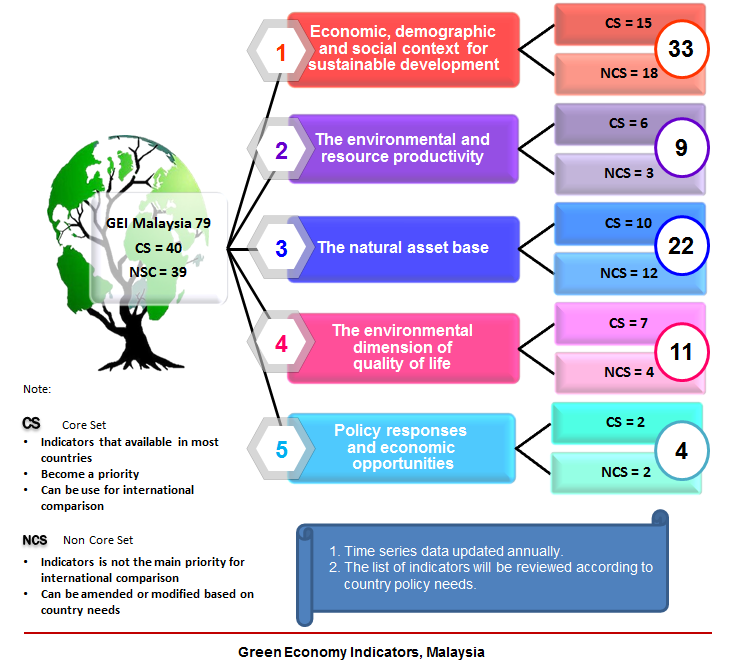
GREEN ECONOMY INDICATORS |
|
|
|
LIST OF GREEN ECONOMY INDICATORS IN MALAYSIA |
|
|
Labour Productivity of Fourth Quarter 2022
|
Malaysia’s labour productivity measured as value added per hour worked improved 1.9 per cent (Q3 2022: 3.8%), year-on-year, as the country’s economy expanded 7.0 per cent for this quarter (Q3 2022 : 14.2%), while total hours worked went up 5.0 per cent (Q3 2022: 10.0%). |
Employment Statistics, Fourth Quarter 2022 |
During the fourth quarter of 2022, the total number of jobs in the economic sector increased by 0.9 per cent to 8.75 million jobs as compared to the last quarter. Meanwhile, a year-on-year growth was 2.6 per cent. The rate of filled jobs and vacancies in this quarter remained at 97.8 per cent (8.56 million) and 2.2 per cent (192 thousand) respectively as compared to the same quarter of the previous year. The number of jobs created in the fourth quarter of 2022 increased by 10 thousand to 30.9 thousand jobs as compared to the same quarter of the preceding year (Q4 2021: 20.9 thousand). It was the highest number recorded since the first quarter of 2018. Compared with the previous quarter, jobs created in this quarter recorded a slower growth of 1.2 per cent (Q3 2022: 3.8%). |
Key Statistics of Labour Force in Malaysia, December 2022
|
Release Date : Thursday 09, February 2023 1200 |
Principal Statistics of Labour Force, Malaysia, Fourth Quarter (Q4) 2022
|
Release Date : Thursday 09, February 2023 1200 |
Informal Sector and Informal Employment Survey Report, Malaysia 2021
|
Malaysia’s Informal Employment reached 3.5 million persons in 2021, contributing 23.2 per cent of the country’s total employment |
Job Vacancies Advertised Online In Malaysia Third Quarter of 2022 |
Release Date : Thursday 22, December 2022 1200 |
Labour Market Review, Third Quarter 2022 |
Labour market continued its recovery at a steady pace in the third quarter of 2022. The normalisation of all economic and social activities strengthened the job market and reduced unemployment as reported in Labour Market Review, Third Quarter 2022. This report also features an article entitled “Exploring the Characteristics of Female Labour Force In Malaysia : Low Participation Despite Potential". Release Date : Thursday 17, November 2022 1200 |
Salaries & Wages Survey Report, Malaysia, 2021 |
Median monthly salaries & wages rose 9.1 per cent in 2021 Release Date : Tuesday 04, October 2022 1200 |
Graduates Statistics 2021 |
In 2021, the number of graduates in Malaysia increased by 4.7 per cent to record 5.61 million persons (2020: 5.36 million persons). The number of graduates in the labour force which encompassed of employed and unemployed rose 4.6 per cent to 4.77 million persons (2020: 4.56 million persons). Meanwhile, graduates’ labour force participation rate (GLFPR) remained as in the previous year at 85.0 per cent. Release Date : Wednesday 27, July 2022 1200 |
Labour Force Survey Report, Malaysia, 2021 |
HEALTHIER GROWTH OF MALAYSIA’S LABOUR FORCE IN 2021 FOLLOWING CONTINUOUS RESUMPTIONS OF ECONOMIC AND SOCIAL ACTIVITIES AMID TARGETED CONTAIMENT MEASURES TO MANAGE THE UNCERTAIN OF CURRENT HEALTH CRISIS Release Date : Wednesday 27, April 2022 1200 |
Employment and Salaries & Wages Statistics 2018 |
This publication presents the Employment and Salaries & Wages Statistics obtained from Annual Economic Survey 2018 for reference year 2017 covers employees working in the formal private sector in Malaysia. In this publication, the Employment and Salaries & Wages Statistics are analysed from various dimensions. Release Date : Monday 30, December 2019 1800 |
Index Of Industrial Production, Malaysia December 2022
|
Industrial Production Index (IPI) grew by 3.0 per cent in December 2022 after recording an increase of 4.8 per cent in November 2022. The expansion in December 2022 was propelled by Mining index (4.1%) and Manufacturing index (3.0%). Meanwhile, the Electricity index turned downward to negative 1.1 per cent during the month. |
Monthly Manufacturing Statistics Malaysia, December 2022
|
The sales value of Manufacturing sector expanded by 8.6 per cent year-on-year in December 2022 to record RM156.3 billion while overall performance reaching RM1.8 trillion in 2022. The expansion of sales value in December 2022 was reinforced by the double-digit growth in Transport Equipment & Other Manufactures subsector (10.9%); Petroleum, Chemical, Rubber & Plastic Products (10.3%); and Food, Beverages & Tobacco Products (10.3%). |
Annual Economic Statistics 2018 Manufacturing Sector
|
This report presents statistics derived from the Annual Economic Survey 2018 for the reference year 2017 in Manufacturing sector. The manufacturing sector includes all industries under Section C classified in the Malaysia Standard Industrial Classification (MSIC) 2008 Ver. 1.0, in accordance with the International Standard Industrial Classification of All Economic Activities (ISIC), Revision 4. Principal statistics such as value of gross output, intermediate input, value added, the number of persons engaged, salaries & wages paid and value of fixed assets are published in this report. |
Annual Economic Statistics 2018: Electricity, Gas, Steam and Air Conditioning Supply
|
In 2017, value of gross output recorded RM61.0 billion as compared to RM54.4 billion in 2015 with an annual growth rate of 5.9 per cent. |
The Value of Gross Output In Electricity, Gas, Steam and Air Conditioning Supply Sector Grew 9.5 per cent
|
This publication presents statistics on electricity, gas, steam and air conditioning supply sector obtained from the Economic Census 2016 for reference year 2015. Electricity, gas, steam and air conditioning supply sector encompass the operation of electric and gas utilities, which generate, control and distribute electric power or gas. Also includes the provision of steam and air conditioning supply. This sector includes all industries in Section D classified under the Malaysia Standard Industrial Classification (MSIC) 2008 Ver. 1.0, in accordance with the International Standard Industrial Classification of All Economic Activities (ISIC), Revision 2008. The last census was conducted in 2011 for reference year 2010. |
The Gross Output Value of RM1.1 Trillion was Registered as the First Ever Achieved Since the First Economic Census Being Conducted
|
This report presents statistics on manufacturing sector which obtained from the Economic Census 2016 for reference year 2015. The main statistics such as the value of gross output, value of intermediate input, value added, number of employees, salaries & wages paid as well as value of fixed assets owned is also presented in this report. |
Annual Economic Statistics 2018: Mining of Petroleum and Natural Gas
|
Value of gross output Petroleum and natural gas mining in 2017 registered an annual growth rate of 7.3 per cent to RM138.6 billion as compared to 2015, RM120.4 billion. |
Economic Census 2016 - Mining and Quarrying
|
Bauxite and Ilmenite Mining Contributed A Gross Output Value of RM1,773.1 Million Compared To RM10.4 Million In 2010 With A Compound Annual Growth Rate of 179.6 Per Cent. |
Petroleum and Natural Gas Industry Recorded the Highest Monthly Average Salaries & Wages of RM13,310
|
This report presents statistics on petroleum and natural gas industry that includes group of extraction of crude petroleum & natural gas as well as support activities for petroleum & natural gas extraction. These statistics were compiled from the Economic Census 2016 for the reference year 2015. |
Malaysia Economic Performance Fourth Quarter 2022
|
Malaysia's economy grew 7.0 percent in the fourth quarter, recorded annual growth of 8.7 per cent in 2022 highest since year 2000 (8.9%) |
Information And Communication Technology Satellite Account 2021
|
Contribution of ICT to the economy remained double-digit at 12.1 per cent |
Capital Stock Statistics 2021
|
Malaysia's economic wealth recorded a value of RM3.28 trillion in 2021 compared to RM3.22 trillion in 2020. |
Tourism Satellite Account 2021
|
Domestic Tourism dominated with 97.4 per cent to tourism expenditure in 2021 |
State Socioeconomic Report 2021
|
In 2021, all states recorded positive performance in line with recovering socioeconomic indicators. |
Micro, Small & Medium Enterprises (MSMEs) Performance 2021 |
Malaysia’s MSMEs’ GDP in 2021 grew to 1.0 per cent (2020: -7.3%), which was slower than Malaysia’s GDP. The same trend was seen since 2020 according to the time series of Malaysia’s GDP and that of MSMEs. Release Date : Wednesday 27, July 2022 1200 |
Gross Domestic Product Income Approach 2021 |
Compensation of employees increased 2.2 per cent, contributed 34.8 per cent to the nominal GDP Release Date : Tuesday 26, July 2022 1200 |
Gross Fixed Capital Formation 2021 |
Malaysia's Gross Fixed Capital Formation (GFCF) for 2021 was RM298.1 billion at current prices, a increase of RM1.5 billion from 2020 and GFCF at constant prices was RM278.7 billion. GFCF recorded a marginal decline of 0.9 per cent at constant prices as compared to negative 14.4 per cent in the previous year. Release Date : Monday 25, July 2022 1200 |
Gross Domestic Product (GDP) By State 2021 |
All states began to recover from the Global COVID-19 Crisis and reported improved performance in 2021. Release Date : Thursday 30, June 2022 1200 |
Malaysia Economic Performance 2021 |
Malaysia’s economy regained its momentum in 2021, with a 3.1 per cent growth from the previous year’s negative 5.5 per cent. Release Date : Friday 13, May 2022 1200 |
Social Accounting Matrix 2015 |
Total household income for year 2015 recorded a value of RM694.1 billion, which dominated by compensation of employees & unincorporated business profits with a share of 72.2 per cent. This is followed by distributed profits 13.3 per cent and social benefits & periodical payments 9.0 per cent. Release Date : Friday 20, December 2019 1200 |
Regional Tourism Satellite Account Sarawak 2018 |
Tourism Industry generated RM11.0 billion value added (GVATI) to Sarawak Region economy The Gross Value Added Tourism Industry (GVATI) has generated revenue of RM11.0 billion for Sarawak Region in 2018. The share of GVATI recorded 7.5 per cent to Sarawak Gross Domestic Product (GDP) in 2018. Release Date : Tuesday 10, December 2019 1200 |
The Performance of State's Economy, 2017 |
Malaysia's economic performance expanded to 5.9 per cent in 2017 as compared to 4.2 per cent in 2016. This performance was supported by a better growth recorded by most states in Malaysia. The growth was driven by the increase in manufacturing and services as well as rebound in the agriculture sector. Release Date : Tuesday 08, May 2018 1200 |
Final National Accounts Statistics, 2005 |
Final National Accounts Statistics (FNAS) 2005 provides a new benchmark for Malaysia’s economic statistics. The benchmarking includes the statistics that are used for the purpose of rebasing The Gross Domestic Product (GDP) and Producer Price Index (PPI) Release Date : Friday 28, January 2011 1405 |
Demographic Statistics Fourth Quarter 2022, Malaysia
|
The Department of Statistics Malaysia has been implemented the rebasing of population figures for the second quarter 2020 until the fourth quarter 2022, meanwhile the population for the third quarter 2010 until the first quarter 2020 will be revised later. |
Key Findings of Population and Housing Census of Malaysia 2020: Urban and Rural
|
Publication Key Findings of Population and Housing Census of Malaysia 2020 Urban and Rural presents statistics by strata of urban and rural comprises population, living quarters, households, ethnic, gender, age, religion, marital status and average private household size. Further explanation on the findings are presented in spatial format. The urbanisation rate in Malaysia increased further to 75.1 per cent (24.4 million) in 2020 as compared to 70.9 per cent (19.5 million) in 2010. |
Statistics on Women Empowerment in Selected Domains, Malaysia, 2022
|
This publication presents gender statistics in Malaysia for the year 2019 to 2021. These statistics focus on the core set of gender indicators covering eleven main domains namely economic structures, participation in productive activities and access to resources; education; health and related services, public life and decision making; human rights of women and girls, social protection (special focus: population ageing); disaster risk reduction; peace and security; refugees; environment and climate change; and international migration. |
Marriage and Divorce Statistics, Malaysia, 2022
|
The publication of Marriage and Divorce Statistics, Malaysia, 2022 presents the statistics of marriage and divorce in Malaysia for 2020 and 2021. The statistics are compiled based on the data obtained from the National Registration Department (NRD), State Religious Department (JAIN), Department of Islamic Development Malaysia (JAKIM), Department of Syariah Judiciary Malaysia (JKSM) and the Council for Customs and Traditions Sarawak (Mais). The statistics are presented by state, administrative district, sex, age group and ethnic group. |
Statistics on Causes of Death, Malaysia, 2022
|
The publication of Statistics on Causes of Death, Malaysia, 2022 presents statistics on the principal causes of death in Malaysia for the year 2021. There were 224.6 thousand deaths recorded in 2021, an increased of 34.5 per cent (57.6 thousand) as compared to 2020 (167.0 thousand). COVID-19 infection (due to) was the principal cause of death in 2021. |
Vital Statistics, Malaysia, 2022
|
The publication of Vital Statistics, Malaysia, 2022 contains birth and death statistics by various demographic characteristics for the year 2021. The number of live births was 439,744 births in 2021, a decrease of 6.7 per cent (31,760 births) as compared to 471,504 births in 2020. This was the highest decrease in a decade. The number of deaths in 2021 was 224,569 deaths, increased 34.5 per cent (57,599 deaths) as compared to 166,970 deaths in 2020 due to COVID-19 pandemic. |
Abridged Life Tables, 2020-2022
|
This publication contains life tables by age group, ethnic group and sex at Malaysia and state. The abridged life tables are generated based on the mid-year deaths and mid-year population estimates. |
Current Population Estimates, Malaysia, 2022 |
Release Date : Friday 29, July 2022 1200 |
Key Findings Population and Housing Census of Malaysia 2020: Administrative District |
Key Findings Population and Housing of Malaysia 2020: Administrative District comprises statistics at small geographical levels namely administrative districts/ jajahan (160), mukim/ sub-districts (1,756) and Local Authority (PBT) (155). This key findings will be used in measuring the achievements of policy implementation by the government towards becoming a nation that achieves sustainable growth with fair and equitable distribution across income groups, ethnicities, regions and supply chains. Release Date : Sunday 29, May 2022 1100 |
LAUNCHING OF REPORT ON THE KEY FINDINGS POPULATION AND HOUSING CENSUS OF MALAYSIA 2020 |
MYCENSUS 2020 RECORDED POPULATION OF 32.4 MILLION PERSONS TO BECOME A NEW BENCHMARK (BASELINE) TO DRIVE THE NATIONAL SOCIO-ECONOMIC PLANNING AND PROSPERITY Release Date : Monday 14, February 2022 1200 |
Selected Demographic Indicators Malaysia, 2019 |
Selected Demographic Indicators Malaysia, 2019 Release Date : Thursday 15, August 2019 1200 |
Population Projection (Revised), Malaysia, 2010-2040 |
The Population Projections (Revised), Malaysia, 2010-2040, presents population projections which have been revised for the year 2010–2040 based on the current changes in births, deaths and migration components. The main population statistics are presented by demographic characteristics such as sex, age and ethnic group. Release Date : Friday 04, November 2016 1200 |
Services Producer Price Index, Fourth Quarter of 2022
|
Services Producer Price Index increased 3.3% in the Fourth Quarter 2022 |
Special Release 2 (For Building and Structural Works) January 2023
|
Release Date : Tuesday 07, February 2023 1200 |
Producer Price Index Malaysia December 2022
|
Malaysia’s Producer Price Index increased to record 3.5 per cent in December 2022 |
Consumer Price Index Malaysia December 2022
|
Malaysia’s inflation in December 2022 eased to 3.8 per cent |
Report of Special Study on Production Cost of Chicken and Egg, 2022
|
Release Date : Friday 30, December 2022 1200 |
Analysis of Annual Consumer Price Index 2021 |
Malaysia’s inflation increased in 2021 with 184 food components in the CPI “basket” recorded increases Release Date : Wednesday 01, June 2022 1200 |
Wholesale & Retail Trade, December 2022
|
Malaysia’s Wholesale & Retail Trade hits all-time high of RM137.3 billion in December, with annual sales amounted RM1.6 trillion in 2022 |
Revenue for Services Sector Fourth Quarter 2022
|
Release Date : Wednesday 08, February 2023 1200 |
Volume Index of Services Fourth Quarter 2022
|
Volume Index of Services rose by 11.7 per cent in the fourth quarter 2022 |
Volume Index of Wholesale & Retail Trade Fourth Quarter 2022
|
Volume Index of Wholesale & Retail Trade Malaysia grew 9.9 per cent in fourth quarter 2022 to register 146.9 points |
Performance of Domestic Tourism By State, 2021 |
Total domestic tourism receipts decline across all states in 2021 Release Date : Friday 30, September 2022 1200 |
Domestic Tourism Survey 2021 |
Domestic tourism spending 2021 fell 54.5 per cent to record RM18.4 billion, but set to recover in 2022 Release Date : Wednesday 29, June 2022 1200 |
Malaysia e-commerce income soared 17.1 per cent to RM279.0 billion in the third quarter 2021 |
Malaysia e-commerce income soared 17.1 per cent to RM279.0 billion in the third quarter 2021 Release Date : Wednesday 10, November 2021 1200 |
Income of E-Commerce Transactions Surged 30.0 per cent in The First Quarter 2021 |
This publication presents statistics on usage of ICT and e-commerce among businesses. Release Date : Tuesday 06, July 2021 1200 |
Malaysian Well-Being Index 2021
|
Release Date : Thursday 01, December 2022 1200 |
CRIME STATISTICS, MALAYSIA, 2022
|
Release Date : Tuesday 29, November 2022 1200 |
CHILDREN STATISTICS, MALAYSIA, 2022
|
Release Date : Monday 28, November 2022 1200 |
Malaysia Happiness Index Report 2021
|
Release Date : Friday 22, July 2022 1130 |
Migration Survey Report, Malaysia, 2020
|
The migration rate decreased by 0.1 percentage points to 1.5 per cent in 2020 as compared to 1.6 per cent in 2018 |
Social Statistics Bulletin, 2019 |
Social Statistics Bulletin, Malaysia, 2019 presents selected social statistics as the basic indicators for measuring the quality of life and well-being of the population. The main areas covered are population, housing, health, education, employment, social services, public safety and communication & recreation. Release Date : Tuesday 26, November 2019 1200 |
Sustainable Development Goals (SDG) Indicators, Malaysia, 2021
|
Release Date : Wednesday 07, December 2022 1200 |
Bumiputera Statistics, 2022
|
Release Date : Tuesday 06, December 2022 1200 |
My Local Stats 2021
|
Release Date : Thursday 17, November 2022 1200 |
Big Data Analytics: National Occupational Accident and Disease Statistics 2021
|
Release Date : Thursday 30, June 2022 1200 |
Report on Special Survey of Ramadan and Aidilfitri Bazaar 2022 Malaysia
|
DOSM for the first time published the Report on Special Survey of Ramadan and Aidilfitri Bazaars 2022 which displays statistics related to sales value, number of persons engaged and number of business stalls. These statistics were presented at national, state and administrative district levels. |
Subnational Statistics of State Legislative Assembly |
Subnational Statistics of State Legislative Assembly are published for the first time for all 600 SLAs in Malaysia Release Date : Sunday 29, May 2022 1100 |
ANNUAL ECONOMIC STATISTICS ALL SECTORS 2021 |
The output of the economic sector in 2020 contracted 6.3 percent or RM196.8 billion to RM2,907.1 billion as compared to RM3,103.9 billion in 2019 Release Date : Monday 31, January 2022 1200 |
Special Report on Impact of Floods in Malaysia 2021 |
Release Date : Friday 28, January 2022 1200 |
NEED MORE DATA ?
Unpublished data can be obtained from Department of Statistics, Malaysia (subject to availability and confidentiality).
Written enquiry can be mailed to the following address:
Director,
Integration & Data Management Division,
Department of Statistics, Malaysia,
Level 7, Block C6, Complex C,
Federal Government Administrative Centre,
62514 Putrajaya, Malaysia.
Email: data@dosm.gov.my
Phone: +603-8885 7774 / 7128 (Data Request)
+603-8885 7709 / 7706 (Payments)
Fax: +603-8888 9248
You may also wish to visit The Department of Statistics, Malaysia at the head office in Putrajaya or any of the state offices: Contact Us
METHODS OF DATA REQUEST / EQUIRY
Data request or any statistical enquiry can be directed to the Department : Order form
Please login eStatistik to continue and submit the data request. Register an account here.
Charges and Payments
Requests for data will be charged at cost recovery basis, depending on the amount of resources used to process and compile the data.
Payment can be made by cash at customer service counter or by bank draft/money order/postal order made payable to AKAUNTAN NEGARA MALAYSIA-JPM-T.
Payment online can be made by credit card or FPX (Direct Debit) via eStatistik.
(Please note that payment by EFT is not accepted).
The data shown in this page correspond to the data described on the International Monetary Fund's Dissemination Standards Bulletin Board (DSBB). Detailed explanation of the DSBB and the statistical standards to which Malaysia has committed, please click on
DSBB Website
|
SDDS Data Category and Component
|
Unit Description
|
Period Of Latest
|
Latest Data
|
Data For Previous Period
|
More Info
|
|
National Accounts (GDP) at Current Prices |
RM Million |
Q4 2022 |
467,306 |
455,830 |
|
| * Agriculture |
RM Million |
Q4 2022 |
36,928 |
40,247 |
|
| * Mining and Quarrying |
RM Million |
Q4 2022 |
43,287 |
44,458 |
|
| * Manufacturing |
RM Million |
Q4 2022 |
111,218 |
108,424 |
|
| * Electricity, Gas and Water |
RM Million |
Q4 2022 |
11,275 |
11,075 |
|
| * Construction |
RM Million |
Q4 2022 |
15,546 |
15,531
|
|
| * Wholesale and Retail Trade, Accommodation and Restaurants |
RM Million |
Q4 2022 |
97,572 |
90,940 |
|
| * Transport & Storage and Communication |
RM Million |
Q4 2022 |
42,518 |
41,332 |
|
| * Finance, Insurance, Real Estate and Business Services |
RM Million |
Q4 2022 |
46,486 |
45,374 |
|
| * Other Services |
RM Million |
Q4 2022 |
18,859 |
18,585 |
|
| * Government Services |
RM Million |
Q4 2022 |
38,708 |
35,113 |
|
| *plus : Import Duties |
RM Million |
Q4 2022 |
4,909 |
4,751 |
|
| National Accounts (GDP) at constant 2015 Prices |
RM Million |
Q4 2022 |
397,191 |
383,775 |
DSBB
|
| * Agriculture |
RM Million |
Q4 2022 |
25,162 |
27,729 |
|
| * Mining and Quarrying |
RM Million |
Q4 2022 |
25,498 |
23,255 |
|
|
* Manufacturing |
RM Million |
Q4 2022 |
95,514 |
92,664 |
|
| * Electricity, Gas and Water |
RM Million |
Q4 2022 |
10,194 |
10,140 |
|
| * Construction |
RM Million |
Q4 2022 |
13,856 |
13,621 |
|
| * Wholesale and Retail Trade, Accommodation and Restaurants |
RM Million |
Q4 2022 |
83,742 |
78,955 |
|
| * Transport, Storage and Communication |
RM Million |
Q4 2022 |
40,087 |
39,134 |
|
| * Finance, Insurance, Real Estate and Business Services |
RM Million |
Q4 2022 |
43,930 |
43,076 |
|
| * Other Services |
RM Million |
Q4 2022 |
17,247 |
16,884 |
|
| * Government Services |
RM Million |
Q4 2022 |
37,608 |
34,119 |
|
| * plus : Import Duties |
RM Million |
Q4 2022 |
4,354 |
4,199 |
|
| Industrial Production Index |
2015 = 100 |
12/2022 |
130.2 |
131.1 |
|
| Employment |
(million persons) |
Q4 2022 |
15.94 |
15.83 |
DSBB
|
| Employment |
(million persons) |
12/2022 |
16.13 |
16.11 |
DSBB
|
| Employment |
% of labour force |
Q4 2022 |
96.4 |
96.3 |
DSBB
|
| Employment |
% of labour force |
12/2022 |
96.4 |
96.4 |
DSBB
|
| Unemployment |
(million persons) |
Q4 2022 |
0.600 |
0.612 |
DSBB
|
| Unemployment |
(million persons) |
12/2022 |
0.600 |
0.601 |
DSBB
|
| Unemployment |
% of labour force |
Q4 2022 |
3.6 |
3.7 |
DSBB
|
| Unemployment |
% of labour force |
12/2022 |
3.6 |
3.6 |
DSBB
|
| Average salaries and wages per employee in manufacturing sector |
RM per month |
12/2022 |
3,665.9 |
3,389.0 |
|
| Consumer Price Index |
2010 = 100 |
12/2022 |
129.2 |
129.0 |
|
| Producer Price Index - Local Production |
2010 = 100 |
12/2022 |
119.6 |
120.0 |
|
The data shown in this page correspond to the data described on the International Monetary Fund's Dissemination Standards Bulletin Board (DSBB). For a fuller explanation of the DSBB and the statistical standards to which Malaysia has committed, please click on
DSBB Website
|
SDDS Data Category and Component
|
Unit Description
|
Period Of Latest
|
Latest Data
|
Data For Previous Period
|
More Info
|
|
Balance Of Payments |
|
|
|
|
|
|
Current Account |
RM million |
Q4 2022 |
25,668 |
14,136 |
|
|
* Goods: Exports f.o.b. |
RM million |
Q4 2022 |
303,481 |
313,190 |
|
|
* Goods: Imports f.o.b. |
RM million |
Q4 2022 |
251,742 |
270,216 |
|
|
* Services: Credits |
RM million |
Q4 2022 |
44,164 |
39,218 |
|
|
* Services: Debits |
RM million |
Q4 2022 |
52,719 |
48,829 |
|
|
* Primary Income: Credits |
RM million |
Q4 2022 |
25,233 |
22,730 |
|
|
* Primary Income: Debits |
RM million |
Q4 2022 |
36,742 |
39,900 |
|
| * Secondary Income: Credits |
RM million |
Q4 2022 |
6,202 |
7,027 |
|
| * Secondary Income: Debits |
RM million |
Q4 2022 |
12,208 |
9,085 |
|
| Capital Account |
RM million |
Q4 2022 |
-67 |
-216 |
|
| * Capital Account: Credits |
RM million |
Q4 2022 |
22 |
21 |
|
| * Capital Account: Debits |
RM million |
Q4 2022 |
89 |
237 |
|
| Financial Account |
RM million |
Q4 2022 |
-1,017 |
-14,856 |
|
| * Direct Investment: Assets |
RM million |
Q4 2022 |
-24,798 |
-17,944 |
DSBB
|
| * Direct Investment: Liabilities |
RM million |
Q4 2022 |
15,416 |
19,932 |
|
| * Portfolio & Financial Derivatives |
RM million |
Q4 2022 |
-28,390 |
-293 |
|
| * Other Investment |
RM million |
Q4 2022 |
36,755 |
-16,550 |
|
| * Reserves Assets (1) |
RM million |
Q4 2022 |
-22,447 |
-13,204 |
|
| * Net Errors and Omissions |
RM million |
Q4 2022 |
-2,137 |
14,141 |
|
| Merchandise Trade |
|
|
|
|
DSBB
|
| * Total exports, f.o.b. |
RM million |
12/2022 |
131,891.54 |
129,663.86 |
|
| * Total imports, c.i.f. |
RM million |
12/2022 |
104,131.55 |
107,907.12 |
|
| * Balance |
RM million |
12/2022 |
27,759.99 |
21,756.75 |
|
| International Investment Position |
|
|
|
|
DSBB
|
| Assets |
RM million |
End Of Q4 2022 |
2,226,689 |
2,254,695 |
|
| * Direct investment |
RM million |
End Of Q4 2022 |
718,440 |
726,116 |
|
| * Portfolio investment |
RM million |
End Of Q4 2022 |
591,069 |
573,938 |
|
| * Equity and investment fund shares |
RM million |
End Of Q4 2022 |
487,919 |
469,278 |
|
| * Debt securities |
RM million |
End Of Q4 2022 |
103,150 |
104,661 |
|
| * Financial derivatives |
RM million |
End Of Q4 2022 |
29,267 |
31,552 |
|
| * Other investment |
RM million |
End Of Q4 2022 |
384,686 |
431,216 |
|
| * Reserve assets (1) |
RM million |
End Of Q4 2022 |
503,227 |
491,872 |
|
| Liabilities |
RM million |
End Of Q4 2022 |
2,163,650 |
2,178,382 |
|
| * Direct investment |
RM million |
End Of Q4 2022 |
991,510 |
984,966 |
|
| * Portfolio investment |
RM million |
End Of Q4 2022 |
653,791 |
661,491 |
|
| * Equity and investment fund shares |
RM million |
End Of Q4 2022 |
222,005 |
207,058 |
|
| * Debt securities |
RM million |
End Of Q4 2022 |
431,786 |
454,434 |
|
| * Financial derivatives |
RM million |
End Of Q4 2022 |
27,192 |
34,599 |
|
| * Other investment |
RM million |
End Of Q4 2022 |
491,157 |
497,325 |
|
| Net International Investment Position |
RM million |
End Of Q4 2022 |
63,040 |
76,313 |
DSBB
|
The data shown in this page correspond to the data described on the International Monetary Fund's Dissemination Standards Bulletin Board (DSBB). For a fuller explanation of the DSBB and the statistical standards to which Malaysia has committed, please click on DSBB Website
|
SDDS Data Category and Component
|
Unit Description
|
Period Of Latest
|
Latest Data
|
Data For Previous Period
|
More Info
|
|
Population |
(million persons) |
2022 |
32.7 |
32.6 |
|
NO |
CATEGORIES |
ANALYTICS |
|
1 |
National Accounts |
|
|
2 |
Balance of Payments |
|
|
3 |
External Trade |
|
|
4 |
Consumer Price Index |
|
|
5 |
Producer Price Index and Import & Export Price Indices |
|
| 6 | External Trade Indices |
|
| 7 | Index of Industrial Production |
|
| 8 | Paddy |
|
| 9 | Rubber |
|
| 10 | Oil Palm |
|
| 11 | Cocoa |
|
| 12 |
Forestry |
|
| 13 |
Fisheries |
|
| 14 |
Mining and Stone Quarrying |
|
| 15 |
Manufacturing |
|
| 16 |
Electricity |
|
| 17 |
Construction |
|
| 18 |
Services |
|
| 19 | Environment |
|
| 20 |
Employment |
|
| 21 | Population |
|
| 22 | Abbreviations & Symbols |
View Pdf
|
Although this Website may be linked to other websites, we are not, directly or indirectly, implying any approval, association, sponsorship, endorsement, or affiliation with any linked website, unless specifically stated herein.
You should carefully review the legal statements and other conditions of use of any website which you access through a link from this Website. Your linking to any other off-site pages or other websites is at your own risk.
Website may use cookies to personalize and facilitate maximum navigation of the User by this site. The User may configure his / her browser to notify and reject the installation of the cookies sent by us.

Federal Territory of Kuala Lumpur

Federal Territory of Putrajaya

Federal Territory of Labuan

Selangor

Negeri Sembilan

Melaka

Johor

Sarawak

Sabah
|
TITLE |
STATISTICS |
|
Principal Statistics of Construction Sector, 2000 - 2015, Malaysia |
|
|
TITLE |
STATISTICS |
|
Annual minimum and maximum air pollutant index for selected stations, Malaysia, 2000 - 2017 |
|
|
Forested and Non-Forested Areas, Malaysia, 2000 - 2017 |
|
|
TITLE |
STATISTICS |
|
Number of government primary and secondary school by District Education Office, and state, 2017 - 2018 |
|
|
Number of government school teachers by District Education Office and by State, 2017 - 2018 |
|
|
Federal Government expenditure on education, Malaysia, 2012 - 2018 |
|
|
Number of government school pupils by District Education Office and State, 2017 - 2018 |
|
|
Number of Graduates by Age Group and Sex, Malaysia, 2016 - 2019 |
|
|
Candidates' achievement of SPM and STPM by category of candidate, Malaysia 2014 - 2018 |
|
|
Number of registered doctors,dentists,nurses and community nurses by state, 2015 - 2017 |
|
|
Number of government hospitals and beds by administrative district and state, 2015 - 2018 |
|
|
Federal government development expenditure, 2014 - 2018 |
|
| Number of Labor Force by State, 1982-2014 |
|
| Employed Persons by State, 1982-2014 |
|
| Employed Persons Working less than 30 hours, 1982-2014 |
|
| Unemployed Persons by State, 1982-2014 |
|
|
Outside labor force by state, 1982-2014 |
|
| Labor force participation rate by state, 1982-2014 |
|
| Unemployment rate, 1982-2014 |
|
| Number of Prisoners by Gender by State, 2016-2019 |
|
|
TITLE |
STATISTICS |
|
Population by age group, sex and ethnic group, 2010 - 2019e, Malaysia |
|
|
Population by state, administrative district and sex, 2016 - 2018 |
|
|
Live births by state and sex, 2009 - 2018 |
|
|
Live births by state, administrative district and sex, 2015 - 2018 |
|
|
Death by state, sex and age group, Malaysia, 2001 - 2018 |
|
|
Number of deaths by state, administrative district and sex, 2015 - 2018 |
|
| Proportion of Infant Immunised Against MMR, DPT, Hepatitis B And Polio, Malaysia, 2000 - 2016 |
|
| Number of cases and incidence rate of communicable disease by state, Malaysia, 2013 - 2018 |
|
| Number and rate Maternal deaths by state, 2010 - 2018 |
|
| Number and rate of Infant mortality by state and sex, 2010 - 2018 |
|
| Number and rate under-5 deaths by state and sex, 2010 - 2018 |
|
| Fertility rate by age group and state, 2001 - 2018 |
|
| Number of new family planning acceptors by type, Malaysia, 2000 - 2017 |
|
| Adolescent birth rate by state, 2001 - 2018 |
|
| Prevalence of underweight among children under 5 years of age by state, Malaysia, 2015 |
|
| Prevalence of food insecurity at household, adult and child levels, Malaysia, 2014 |
|
| Proportion of adults who are obese by state, sex and age group, Malaysia, 2011 and 2015 |
|
| Prevalence of stunting among children under 5 years of age by state, Malaysia, 2015 |
|
| Prevalence of wasting by state, Malaysia, 2015 |
|
| Crude Death Rate, Malaysia, 1911 - 2014 |
|
| Crude Birth Rate, Malaysia, 1911 - 2014 |
|
| Crude Rate of Natural Increase, Malaysia, 1932 - 2014 |
|
| Infant Mortality Rate, Malaysia, 1922 - 2014 |
|
| Maternal Mortality Ratio, Malaysia, 1933 - 2014 |
|
| Neonatal Mortality Rate, Malaysia, 1935 - 2014 |
|
| Toddler Mortality Rate, Malaysia, 1955 - 2014 |
|
| Under-5 Mortality Rate, Malaysia, 1935 - 2014 |
|
| Total Fertility Rate Malaysia, 1958 - 2014 |
|
| Life Expectancy at Birth by Sex, Malaysia, 1966 - 2015 |
|
| Population ('000), 1891 - 2015, Malaysia |
|
Write one or two paragraphs describing your product or services.
Start with the customer – find out what they want and give it to them.
Start with the customer – find out what they want and give it to them.
Start with the customer – find out what they want and give it to them.
Start with the customer – find out what they want and give it to them.
Start with the customer – find out what they want and give it to them.

Malaysia
Federal Territory of Kuala Lumpur
Federal Territory of Putrajaya
Federal Territory of Labuan

Perlis

Kedah

Pulau Pinang

Perak

Kelantan

Terengganu
Selangor
Negeri Sembilan
Melaka
Johor
Sarawak
Sabah
To be successful your content needs to be useful to your readers.
To be successful your content needs to be useful to your readers.
Start with the customer – find out what they want and give it to them.